: Updated situation in the World, 29 April 2020")
The most recent report (report 100, April 29th) published by the World Health Organization indicates that more than 3 Millions of people have been globally confirmed as COVID-19 cases (https://www.who.int/emergencies/diseases/novel-coronavirus-2019/situation-reports).
With respect to my previous update (as of April 22nd, http://www.emigrantrailer.com/2020/04/23/corona-virus-covid-19-updated-situation-in-the-world-22-april-2020/), there were no significant changes. In this article, the average daily values refer to those calculated in the last seven days, unless differently specified.
Figure 1 (Worldwide cases > 100000)
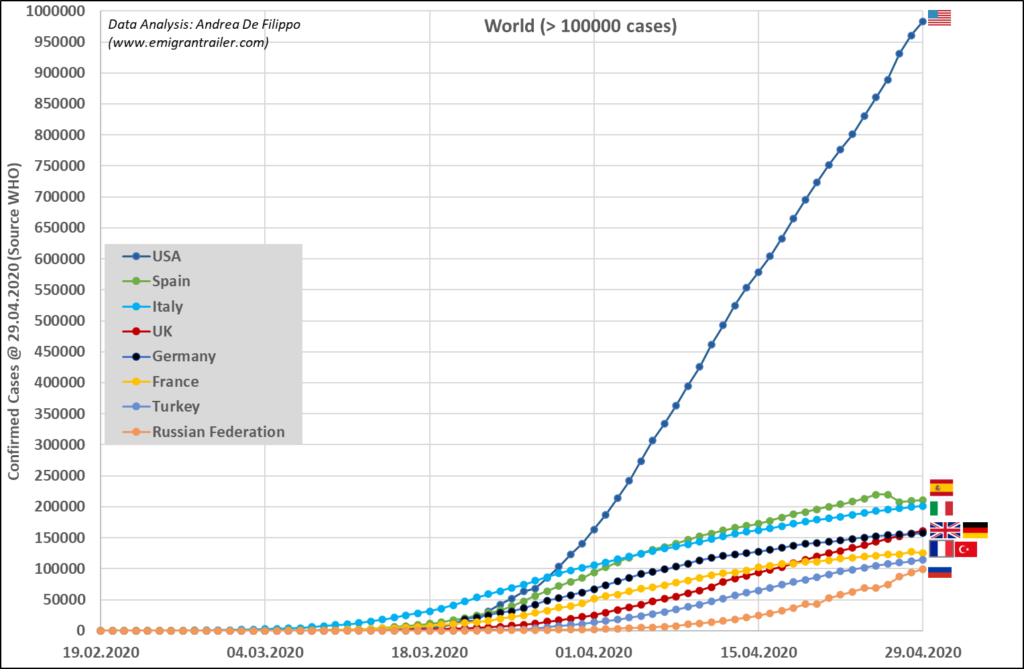
Turkey and Russian Federation are the new entries, even if the latter it is still few units (99399) below the indicated threshold. However, the rate of increased cases for the Russian Federation is very high: about 6000 cases/day in the last seven days. On the other hand, Turkey is facing a slowdown of cases: 2700 cases/day vs 4400 cases/day in the former week.
The situation is the United States of America (USA) remains stable at very critical levels: about 29000 cases/days. The threshold of 1 Million of cases is not far. The rate of increased cases is still high for the United Kingdom (UK) with about 4600 cases/day. Instead, Spain, Italy (2500 cases/day), Germany (1700 cases/day) and France (1300 cases/day) continue the slowdown of the increased cases.
Two additional considerations about Spain and Germany.
Spain: as indicated by the WHO: “The Ministry of Health, Consumer Affairs and Social Welfare of Spain has recently changed its criteria for reporting COVID-19 cases to include only those with positive polymerase chain reaction (PCR) test results. This has resulted in a retrospective decrease of 12,130 cases. Spain will continue to report only new PCR positive cases” (https://www.who.int/docs/default-source/coronaviruse/situation-reports/20200427-sitrep-98-covid-19.pdf?sfvrsn=90323472_4). This explains the negative jump visible in the Figure 1 on April 27th.
Germany: as of April 20th, with all the precautions recommended by the national and local governments, some activities restarted. In the last days, many Italian media and news reported that this has created an increase of cases in Germany. This is FALSE. In fact, both data reported in this article and the official source of data for Germany (Robert Koch Institute), indicate that the slowdown is continuing, even in the period after April 20th. For additional information, please look at the website of the Robert Koch Institute:https://www.rki.de/DE/Content/InfAZ/N/Neuartiges_Coronavirus/Fallzahlen.html
Figure 2 (Worldwide cases > 20000)
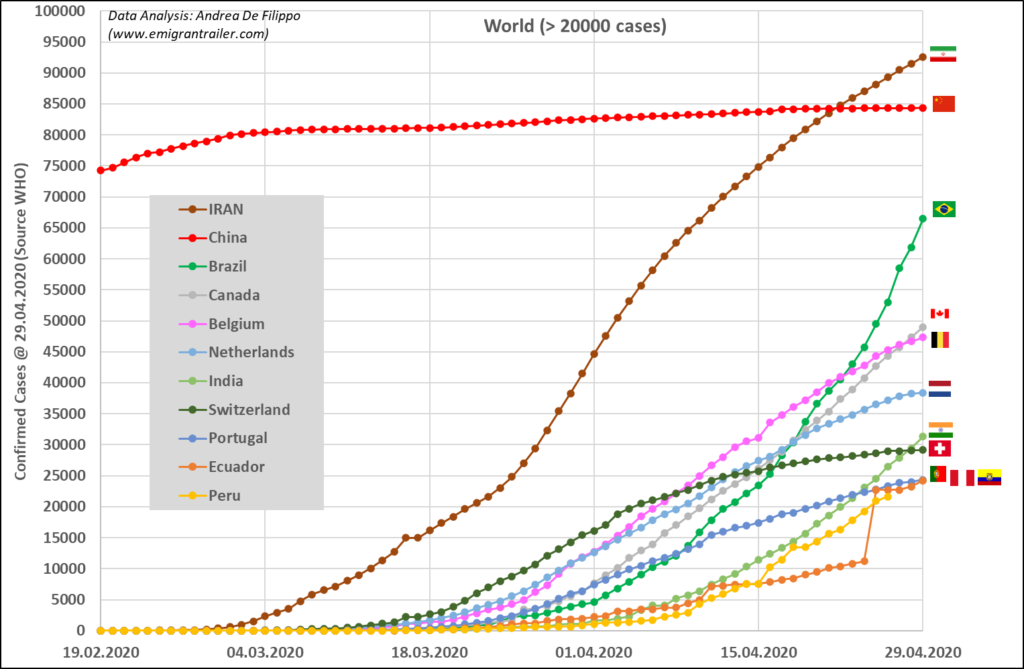
The Republic of Iran is on the right track to flatten the curve with about 1100 cases/day. Every week the situation is improving.
Belgium (about 900 cases/day) starts to give positive signals for slowing down the fast increase trend of last weeks. Instead, Netherlands (611 cases/day), Portugal (420 cases/day), Switzerland (171 cases/day) and China (11 cases/day) continue the fast slowdown of increased cases.
The situation slightly improved, but remains critical, in Brazil (3700 cases/day), in Ecuador (about 1900 cases/day), in Peru (> 1700 cases/day), Canada (1700 cases/day), and in India (1600 cases/day).
Figure 3 (Worldwide deaths > 10000)
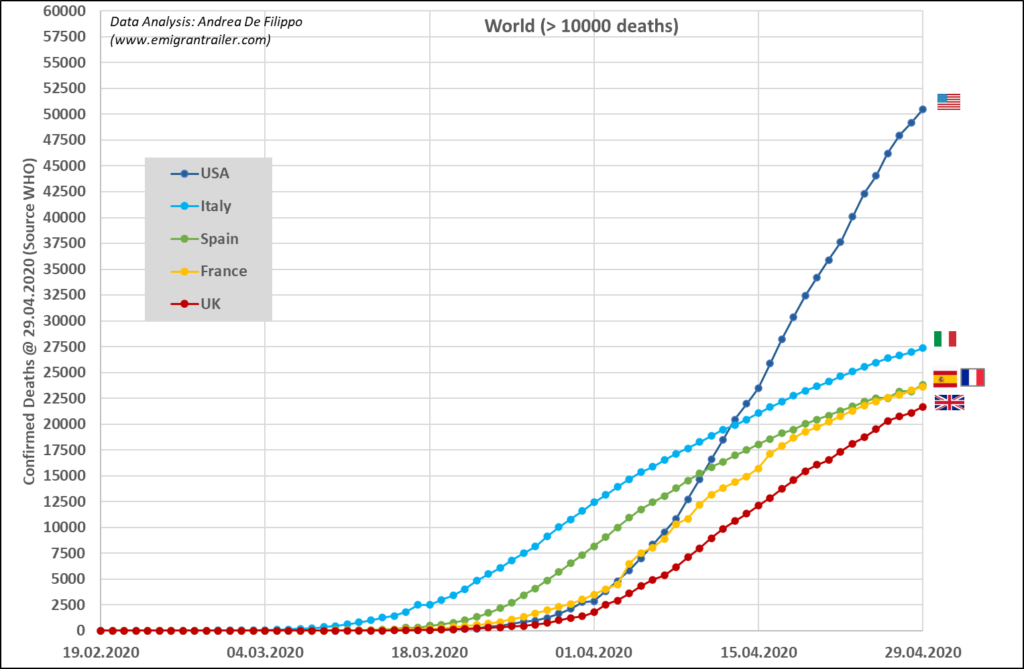
Compared to last week, the situation is basically unchanged in terms of most critical nations. However, some positive signals are documented with a general trend of decreasing deaths/day. The United States of America (USA) reached 50000 deaths and have about 1800 deaths/day. For the European nations, UK (> 600 deaths/day) remains the one with the worst situation, followed by France (> 400 death/day) and by Italy and Spain, both around 380 deaths/day).
Indeed, these average deaths/days remain too high.
Figure 4 (Worldwide deaths > 2000)
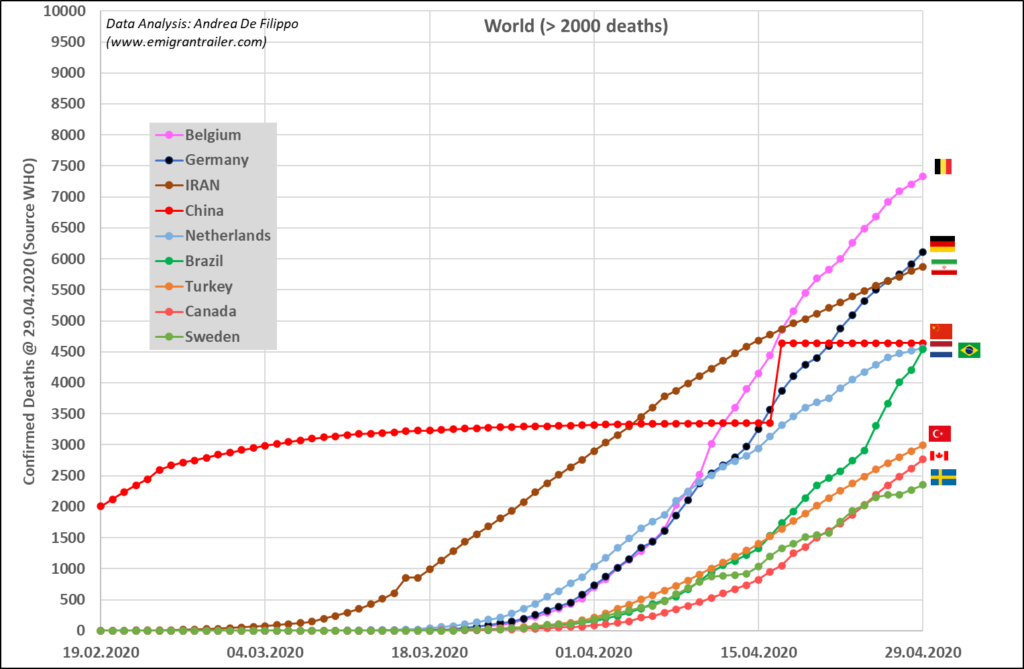
During the last week the situation improved in Belgium (with a decrease from 260 to 190 deaths/day), in Germany (with a decrease from 220 to 180 deaths/day), in Turkey (with a decrease from 120 to 100 deaths/day) in Netherlands (with a decrease from 130 to 90 deaths/day). Sweden slightly decreased from 95 to 85 deaths/day. The Republic of Iran maintains below 85 deaths/day. China had only 1 death in the last week: the ideal situation for all other nations.
Instead, Brazil (with an increase of 280 vs 170 deaths/day) and Canada (with an increase of 150 vs 130 deaths/day) are worsening and the trendline is not very optimistic.
Figure 5 & Figure 6: other European countries
Figure 5 & Figure 6 show the situation for other European countries, with cases below 20000 (Figure 5) and deaths below 2000 (Figure 6).
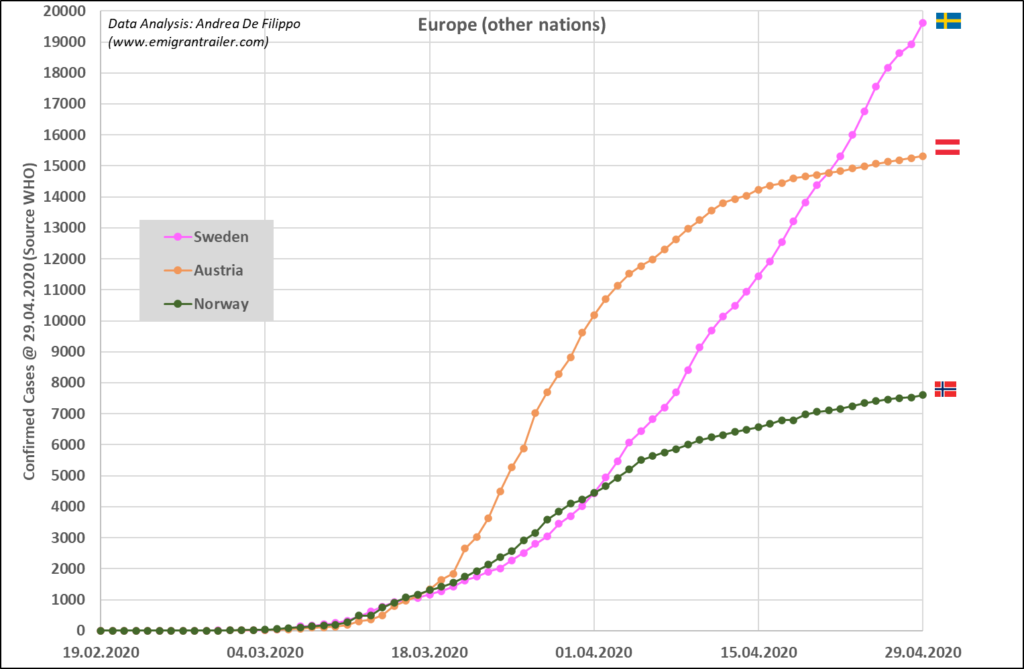
Even if the chart contains only three nations, I decided to maintain it because it shows how three similar countries have experienced different situations. Sweden and Norway are two neighboring nations, with similar climate (4°C vs 3 °C, average of last three months), similar population density (23 vs 17 inhabitants/km2), similar age structure of the population over 65 years (20,1 % vs 17.1 %), similar health expenditure on health per capita (both more than 5000 $ per year). They mainly differ for the total population (respectively about 10.4 Million for Sweden and 5.2 Million for Norway) and simultaneously for the city population distribution above 100000 inhabitants (10 cities for Sweden vs 4 cities for Norway). The last two factors are important when combined with “lockdown” measures. In fact, Sweden did not strictly apply these measures compared to Norway. The results are visible in Figure 5 and Figure 6, where Sweden shows increasing curves while Norway show “flattened” curves.
The same flattened curves are present in Austria. The latter is very similar to Sweden in terms of population (about 9 Million) and city population distribution (1 city above 1 Million of inhabitants, like in Sweden). In my opinion, Austria shows what could have happened in Sweden with more restrictive measures in the critical period (March 2020).
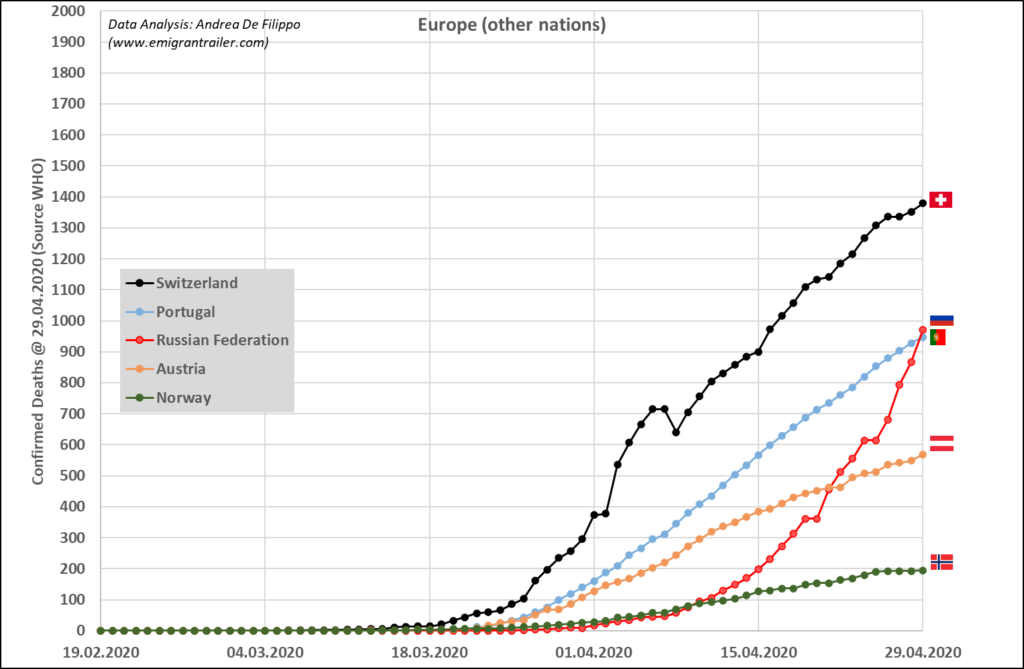
Figure 6 also reports the status of deaths for some nations with high number of cases (>20000): Switzerland, Portugal and the Russian Federation. Compared to former week, Switzerland and Portugal shows minimal improvements with 27 deaths/day while the Russian Federation worsened from 46 to 66 deaths/day.
Figure 7 & Figure 8: other Asian and Oceanian countries
Figure 7 & Figure 8 show the situation for other Asian and Oceanian countries, with cases below 20000 (Figure 7) and deaths below 2000 (Figure 8).
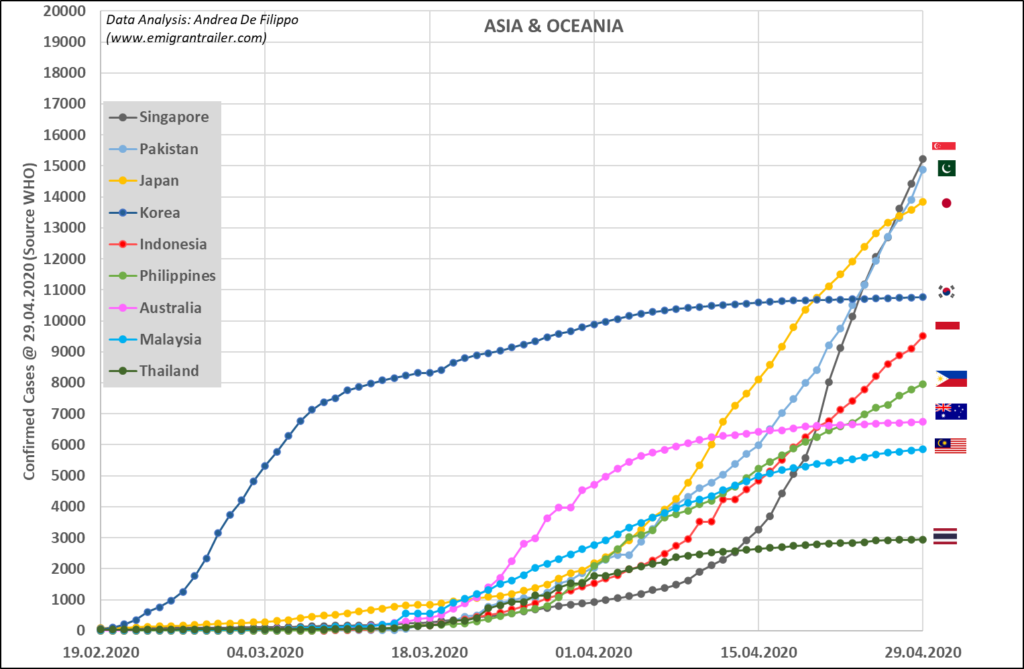
In general, the evolution during last week still confirms that there are several countries which show a tendency to flatten the curve for the documented cases & deaths: South Korea (with an average of about 10 cases/day and 1 deaths/day), Australia (with an average of about 13 cases/day and 2 deaths/day), Malaysia (with an average of about 53 cases/day and 1 deaths/day) and Thailand (with an average of about 17 cases/day and 1 deaths/day).
Singapore remains a “special” situation. In fact, it is one of the nations with COVID-19 cases since January and with a tendency to increase the cases day by day (still an average of > 870 cases/day), but with a very low amount of deaths (14 in absolute) (Figure 8).
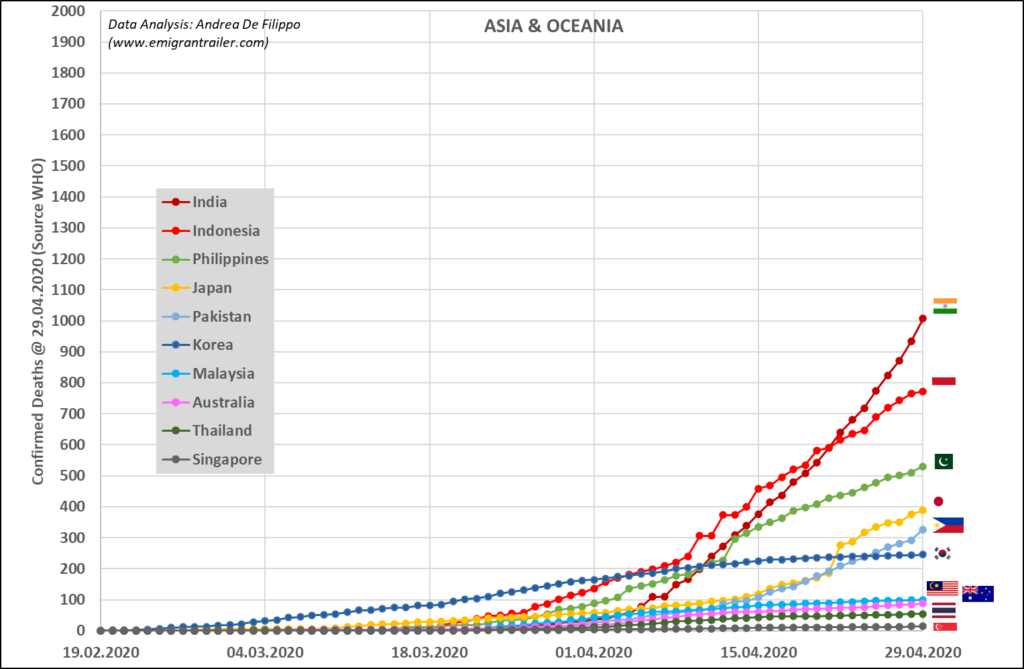
India has worsened its situation in the last two weeks, becoming the third country in Asia (after China & Republic of Iran) for number of cases (> 30000, see Figure 2). The negative trend is also very visible when we look at the deaths in Figure 8: in terms of absolute values is still low (but now >1000) compared to its population, but the average deaths/day is increasing (52 vs 37 deaths/day). The same happened in Pakistan that increased both cases/day (730 vs 540) and deaths/day (17 vs 14).
Last week, the situation remained stable for Indonesia (340 cases/day and 22 deaths/day) and Philippines (190 cases/day and 13 deaths/day). Instead, Japan showed improvements for both cases/day (337 vs 487) and deaths/day (16 vs 23).
Figure 9 & Figure 10: other American and African countries
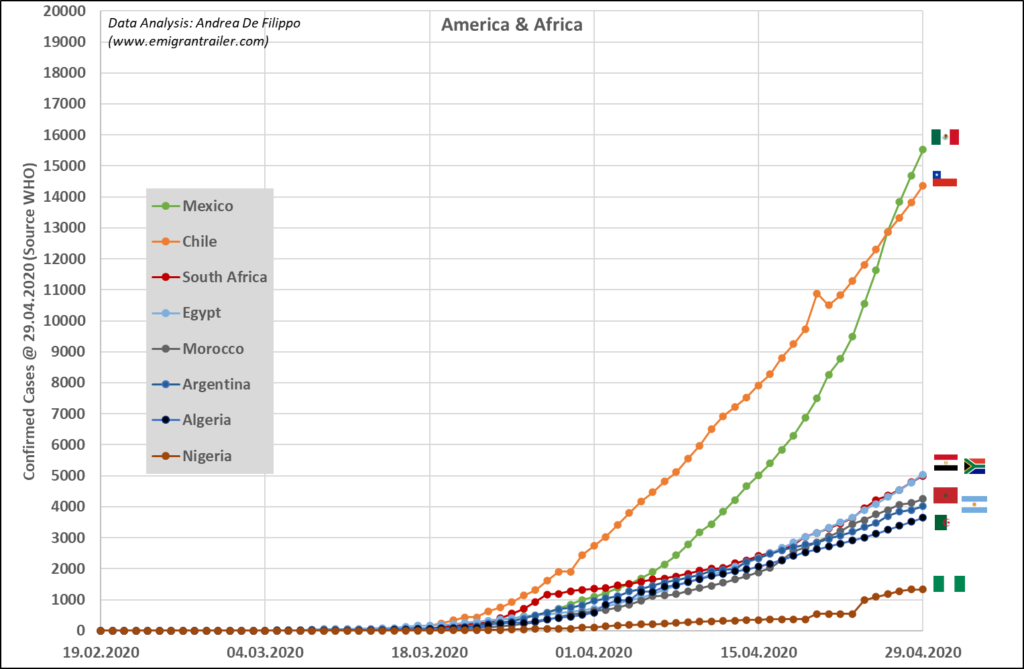
Compared to previous week, Mexico has almost doubled the number of cases/day (965 vs 562) and more than doubled the number of deaths/day (103 vs 51). Chile also worsened the number of cases but, at least, this did not reflect in a deterioration of deaths/day (still below 10).
For all the other nations (South Africa, Argentina, Algeria, Egypt and Nigeria), there are negative signals of slow but progressive increases of case. The tendency needs to be monitored in the upcoming week. Only Morocco showed an improvement compared to past week (149 vs 197 cases/day).
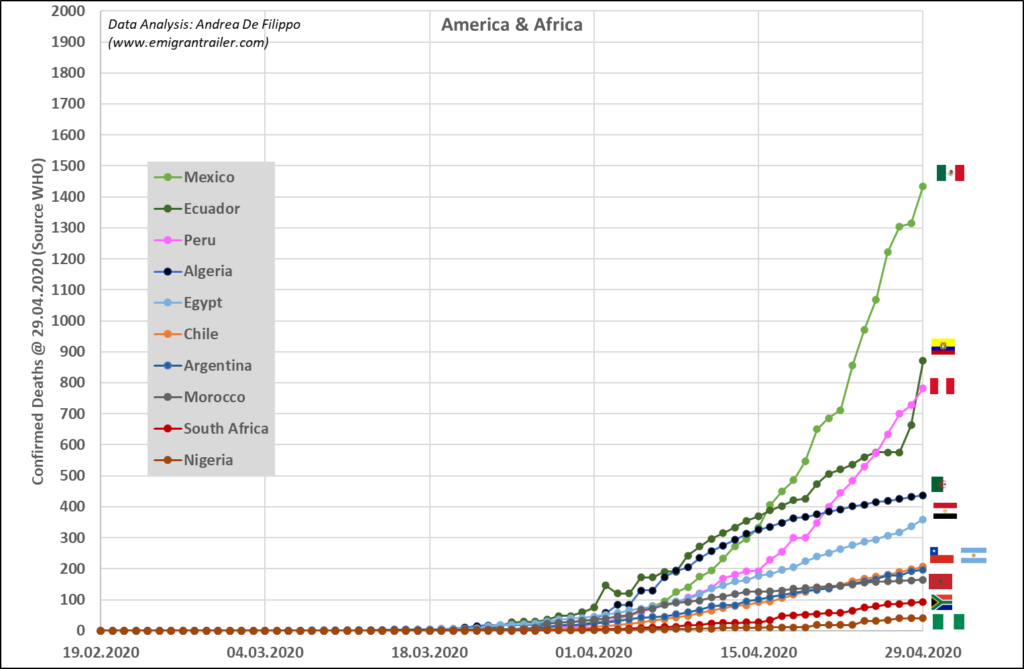
Finally, as showed in Figure 10, Ecuador and Peru are still below 1000 deaths. However, the trendline is not very positive with about 50 deaths/day.
Conclusions
In summary, signs of improvement are coming from the most affected European nations. But the current values are still far away from those of other countries (mainly in Asia and Oceania) where the curves are flattened. The situation in the United States of America remains critical and simultaneously negative signals start to arrive from South America and African countries.
Next update in about one week.
Other analysis and post about COVID-19: COVID-19 (Corona Virus) | EmigranTrailer.
Andrea De Filippo
_______________________________________________________________________________
Please find below the link to each Figure presented in post:


