: How effective is quarantine and social distancing? Latest data from Italy")
On March 22nd, I summarized all the possible factors in the contagion´s spread and deaths of COVID-19, reporting the relative situation in different nations and Italian regions.
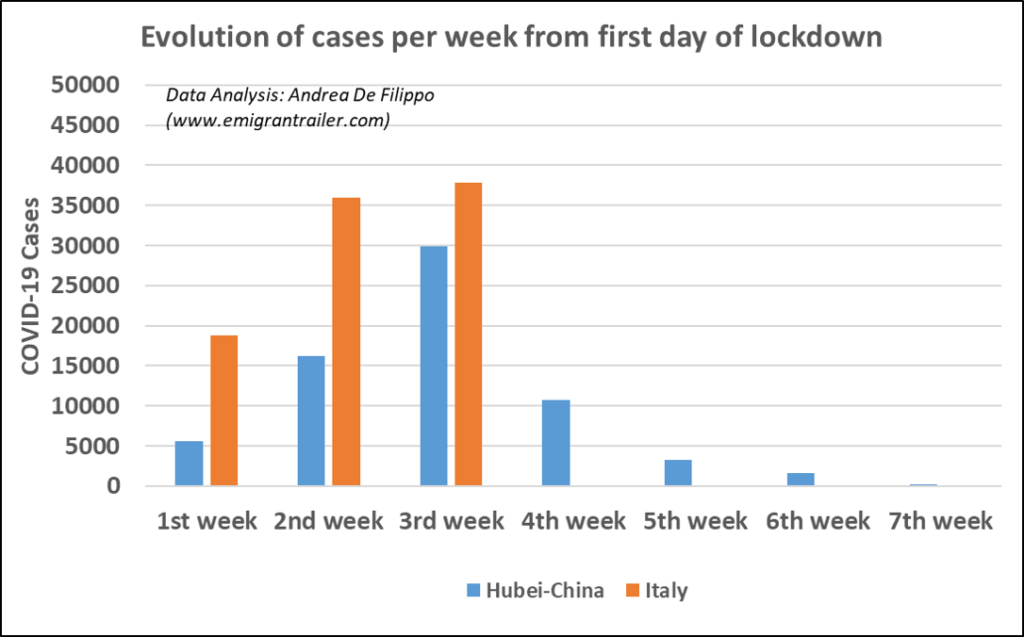
One of the conclusions of that analysis was the confirmation that the lock down of certain areas for the needed/necessary time would have helped dramatically (http://www.emigrantrailer.com/2020/03/22/corona-virus-covid-19-summary-tables-to-understand-the-situation-in-different-nations-and-italian-regions/). The data from Hubei province in China were the basis to support this conclusion (see blue bars in Figure 1).
Restrictive measures have been introduced in Italy on March 9th, with several revisions in the following days. However, since the publication of the first legislative decree (valid from March 10th), named #Iorestoacasa (#Istayathome), I evaluated the progression of COVID-19 cases and deaths in Italy, tracking the official number published by the Italian government. The aim was to monitor the effectiveness of the decree.
After three weeks, it is time to verify if these countermeasures are producing the desired effects. From a high-level perspective, the Italian trend (see orange bars in Figure 1) seems to be aligned to the observed trend for the Chinese province. In particular, the increase between the second and third week in Italy was less marked compared to the Hubei.
However, considering that the situation might different for the specific areas where the COVID-19 is spread, I decided to separate the Italian regions as follow:
- North Central – Italy: Lombardy and Emilia Romagna
- North East – Italy: Veneto, Friuli Venezia Giulia (Friuli V.G.), Trento and Bolzano
- North West – Italy: Piedmont, Aosta Valley (VdA), Liguria;
- Central Italy – Northern part: Tuscany, Umbria and Marche;
- Central Italy – Southern part: Lazio, Abruzzo and Molise;
- South – Italy: Campania, Apulia, Calabria and Basilicata;
- Islands – Italy: Sicily and Sardinia;
For each area I plotted the evolution of the cases, calculating how many new cases were registered every three days (start date: March 9th; end date: March 31st). In fact, it is my opinion that the daily analysis is a bit misleading: some of the data shared by the Italian government every evening is still “pending”, waiting for a confirmation that usually arrives during the following day.
Moreover, I also reported a simple polynomial trendline, with the aim to facilitate the understanding of the trend but, definitively, not to guess or speculate on potential dates when this crisis is over.
As expected, (namely, the effect of the countermeasures cannot be from day 1), all the regions still showed an increase of cases in the first ten days after the publication of the decree. Therefore, for this analysis, most important part is the last twelve days, after March 19th.
Northern Italy (central part)
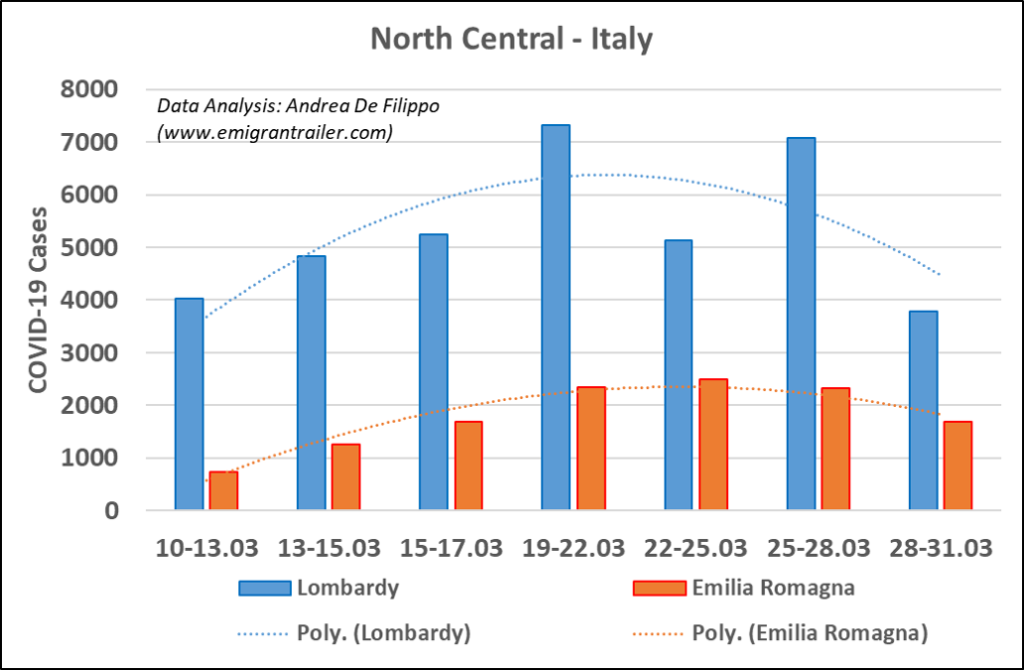
In this specific period, both Lombardy and Emilia Romagna show a stabilization or reduction of the detected cases (see Figure 2). The increase of cases is still high, but there is a trend for a continuous reduction.
Northern Italy (eastern part)
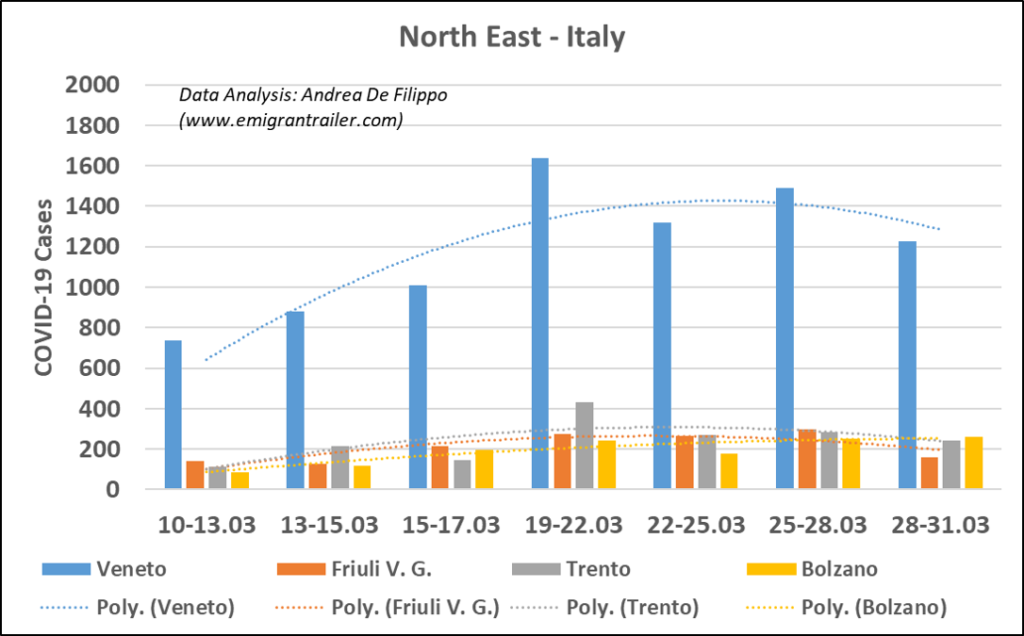
Same consideration for the North East regions (see Figure 3). Indeed, this is a good signal with allows a bit of optimism towards the upcoming weeks.
Northern Italy (western part)
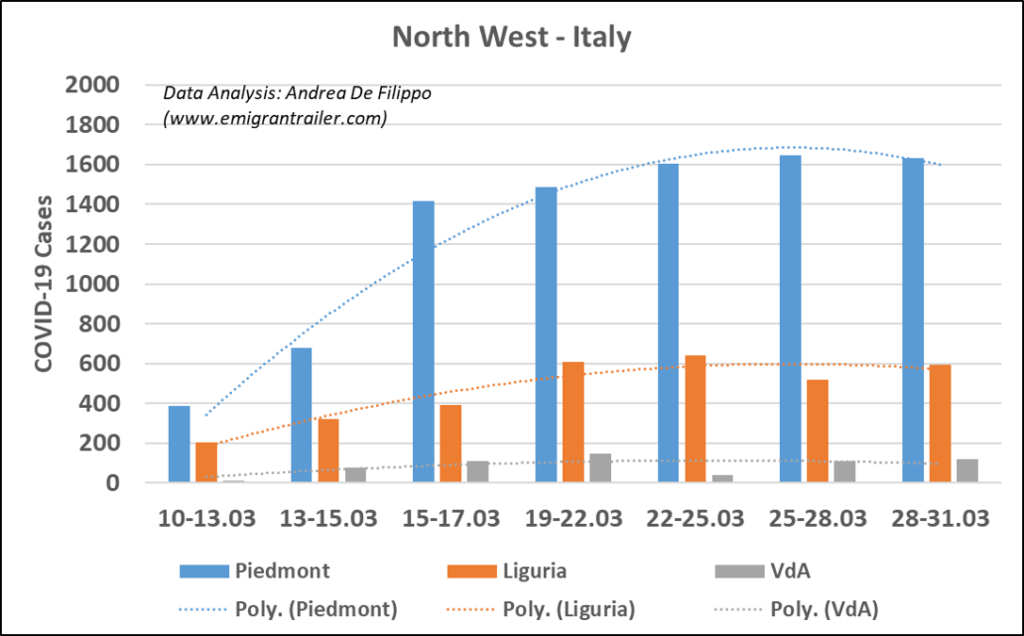
Instead, the regions in the North West of Italy do not show yet similar trends compared to the other northern regions. In particular, Piedmont does not show still a clear reduction and overall number of new cases detected is basically stable or slightly increasing in the last 10 days (see Figure 4). The situation requires to be properly monitored in the next days and it should be also a warning signal to everybody to maintain the social distances and respect all the precaution´s guidelines.
Central Italy (northern part)
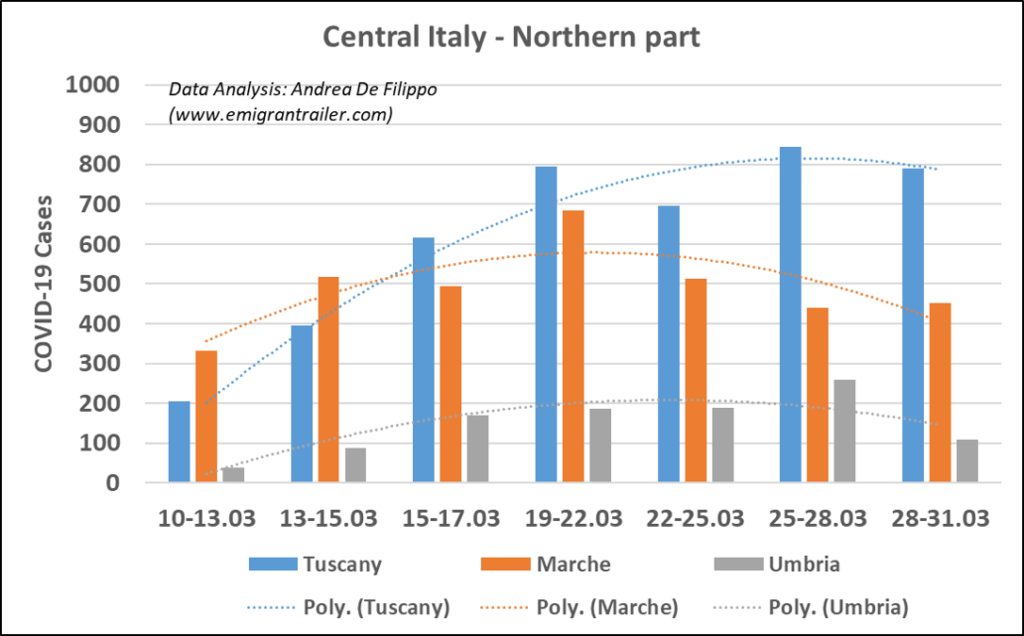
Let´s move to the central regions, characterized by a general lower amount of cases compared to the northern region. The trend for the Marche and Umbria is similar compared to the northern regions; on the other hand, Tuscany shows only recently a mild decrease (See Figure 5). The reason might be the fact that the COVID-19 arrived later in these areas. Therefore, like for Piedmont, the level of attention requires to stay high.
Central Italy (southern part)
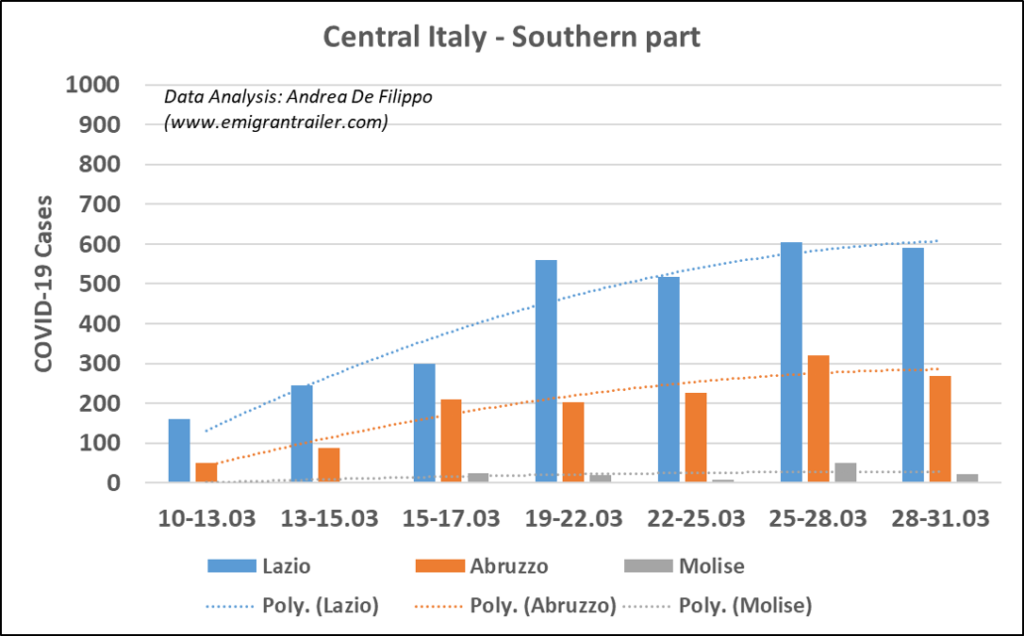
The other three central regions have also a similar situation (see Figure 6). Obviously, this is not a good signal. In absolute values, we are talking about low numbers compared to the northern regions. However, we have learned how fast the COVID-19 can change the scenario. So, no panic, but again all the precaution´s measures should be adopted and respected.
Southern Italy
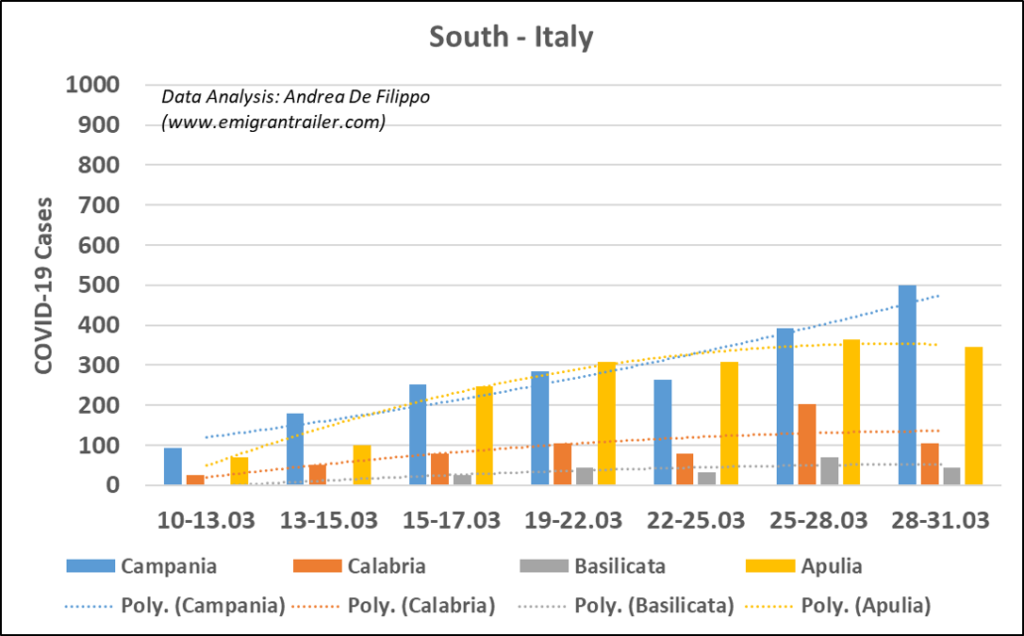
When we move to the southern regions, the trend indicates an increase (see Figure 7), especially when we focus on Campania (blue bars) and Apulia (yellow bars). Of course, this is not comparable to the severe increase of the first days of the crisis in the northern regions. However, it is an increase! Therefore, this trend should be very well communicated to the inhabitants of these area. It is true that for Italy we have a general “positive trend” (driven by Lombardy, the largest contributor), but when we look at specific cases (like in Figure 7), we should be careful to apply “positive trend” here. Otherwise, there is a high risk of underestimation of the still existing problem.
Islands
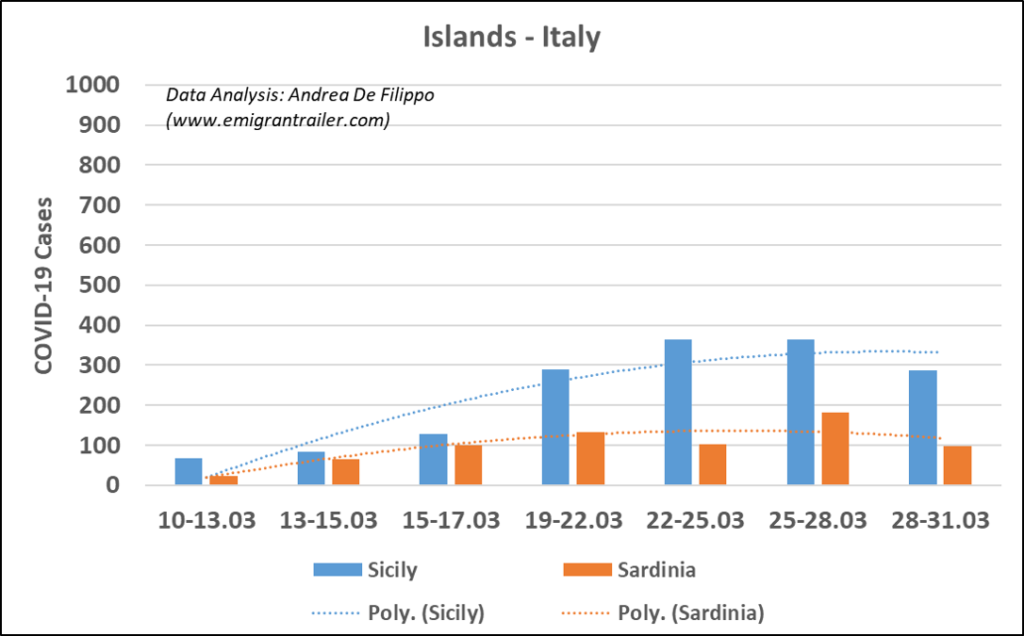
Figure 8 focuses on the two big islands: Sicily und Sardinia. The last days indicate a reduction in both cases.
What is the take away of this analysis?
The quarantine and the implementation of stronger isolation rules is definitively bringing positive signals, especially in those regions highly affected by the COVID-19 at beginning of the crisis. However, other Italian regions do not show yet these positive signals. This means that we are on the right way, but still far away to relax and to loosen the current restrictive rules.
I hope that the trendlines showed in this article help people to understand how important is the contribution of each single person. If these charts are not sufficiently clear, I would like to share an interesting simulation published by Grant Sanderson on March 27th. He simulated the spread of the virus with a visual approach based on mathematical calculations. The message of the video is self-explicative. You can watch it at this link: https://www.youtube.com/watch?v=gxAaO2rsdIs
Finally, I will not publish the trend evolution for the deaths in the same analyzed period. Except for few regions, this trend is still increasing. This is not surprising, since the deaths have a natural delay compared to the COVID-19 cases and we must wait at least other two weeks to evaluate the effectiveness of the quarantine on this sad aspect of the crisis.
Other information and analysis about COVID-19 at the link: COVID-19 (Corona Virus) | EmigranTrailer.
Stay healthy!
Andrea De Filippo


