: age, smoke, alcohol, obesity and health among different nations and Italian regions")
In the last days I exchanged ideas and opinions regarding the growth rate of the COVID-19 spread in Italy and on the consequent high rate of deaths. About the latter, I have already stated that it is appropriate lo let the doctors and the medical experts explaining the root causes, since they are the only one with the opportunity to evaluate in details case by case.
In general, beyond the analyzed factors for the different Italian regions (https://www.emigrantrailer.com/2020/03/16/corona-virus-covid-19-contagions-spread-and-deaths-in-italy/) I asked myself if, among the different nations, there are common factors to explain the different percentages that are communicated in these weeks.
Thus, I spent some time to analyze the official data provided by the World Health Organization (WHO), published at 17th March (https://www.who.int/docs/default-source/coronaviruse/situation-reports/20200317-sitrep-57-covid-19.pdf?sfvrsn=a26922f2_4) for the following Nations: Italy, Spain, Iran, South Korea, France, Germany, China, the United Kingdom (UK), Singapore, Japan and Indonesia.
Covid-19 cases: absolute values and in relative to the population
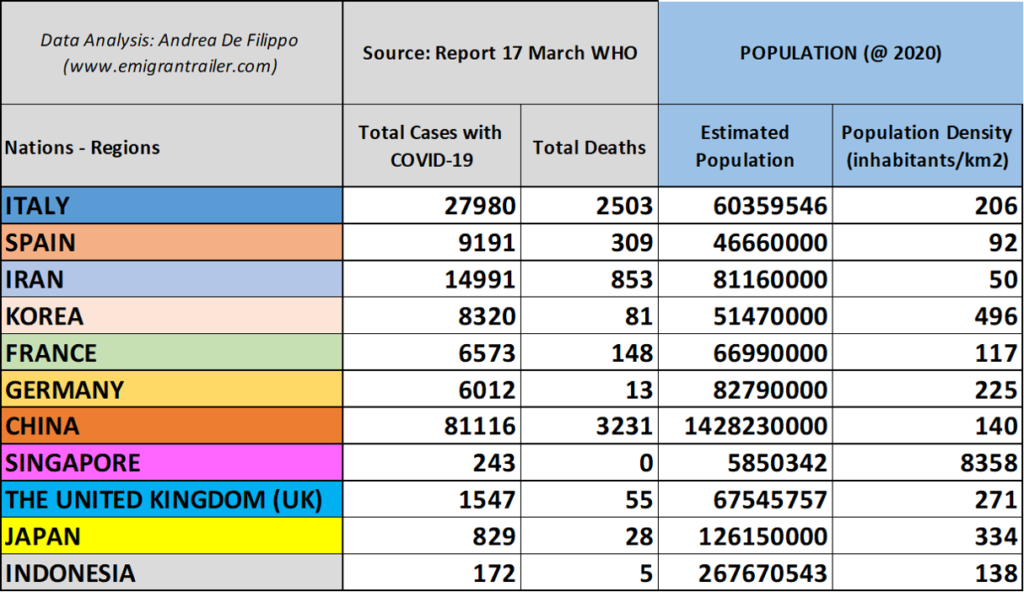
The choice of these Nations is driven by the fact that some of them show the highest number of cases with COVID-19 (China, Iran, Italy, South Korea), other have a slow increase of cases in the last weeks (Japan, Singapore and Indonesia), other have a fast increase of cases (Spain, France, the United Kingdom and Germany). Moreover, these selected Nations differ for population and population density (see Table 1), which was an important factor for the spread of the virus in the northern Italian regions: Lombardy, Piedmont, Emilia Romagna & Veneto.
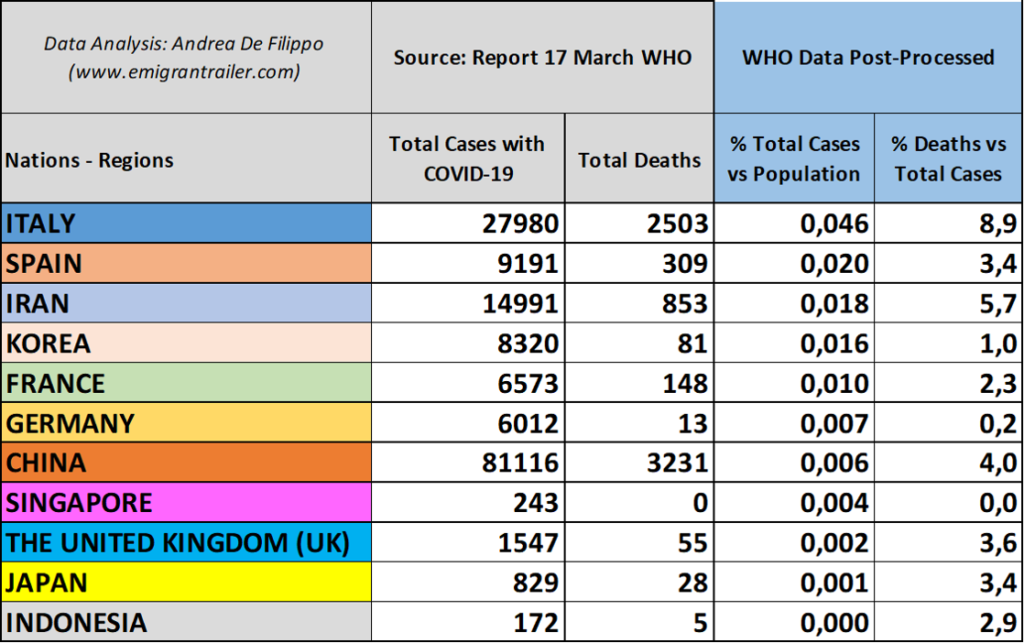
Post-processing these data, I classified the different Nations following the order of cases with COVID-19, with respect to the specific national population (see Table 2). The values are expressed in percentages. Italy is at the top of this classification, followed by Spain and Iran. Secondly, I calculated the percentage of deaths with respect to the documented cases. The results are showed in the other right column: Italy is still at the first place, followed by Iran and China. Spain is now at the fifth place, just behind the United Kingdom (UK).
Obviously, this table shows the current situation and we have to consider that the scenario could change in the upcoming days and weeks, depending on the countermeasures that each nation will apply.
The population age and the percentage of over-65
Once completed this baseline of data, I tried to match them with other data related to several factors, in order to find out possible correlation and explain the behavior among the different nations. The first analyzed factor are the population age and the percentage of over 65 for each nation (see Table 3).
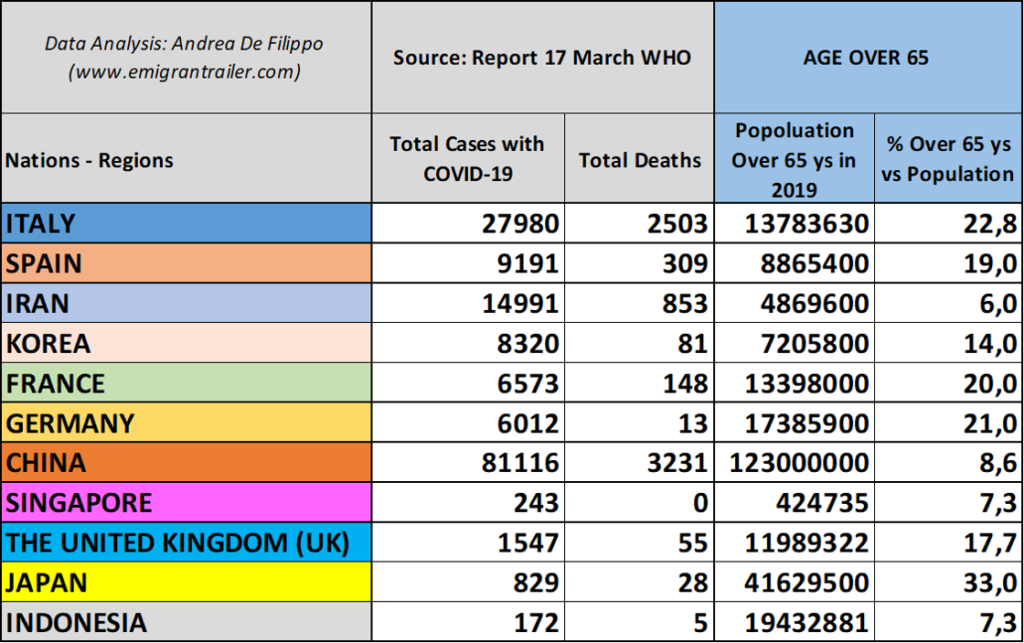
Like already explained in a former article, Italy has a high percentage of over 65, significantly higher than China, Korea and Iran while it is only slightly higher than the one of Germany, France, Spain and the United Kingdom (UK). The correlation with the numbers in the left columns is good (namely higher the percentage of over 65, higher the percentage of cases and deaths) but not perfect, since there are two nations that do not fit this correlation: Japan and Iran. In fact, Japan shows the highest percentage of over 65 (greater than Italy) but does not have a high number of cases and deaths like Italy has. Simultaneously, Iran has a very low percentage of over 65 compared to most of the other nations, but it places second for percentage of deaths (see Table 2). Side note: for Japan, I indicated 33% for the % over 65, but I also found sources indicating 27% or 28%. In any case, it is the highest value compared to all other nations.
Number of smokers and the percentage per nations
Starting from these two inconsistencies (and well aware that the root causes could be several), I decided to look to other factors that can have a significant influence on the rate of deaths. The first analyzed factors are the number of smokers and the percentage of smokers per nations (see table 4). The source of this set of data is the “WHO global report on trends in prevalence of tobacco smoking 2015”. In the table, the values in red for Singapore, the United Kingdom and Japan are not coming from this WHO report, but are collected from the statistics of each nations. For the South Korea, I could not find a good valid source and I preferred to leave incomplete this cell.
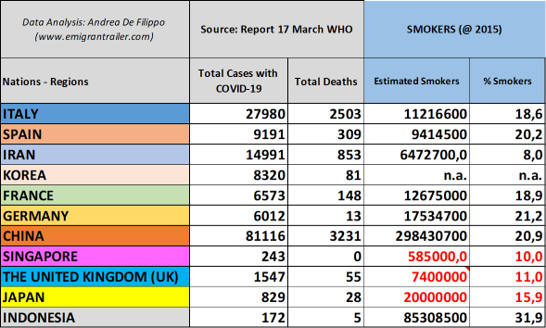
The take away of this table is that the smoke does not seem to play a crucial role to explain the situation that Italy is experiencing. There are not so great differences between Italy, Spain, France, Germany, and China. However, it can be observed that the nations with low percentage of smokers are at the bottom of this table: for instance, Japan has a lower percentage which would fit with a better situation regarding the percentage of deaths.
However, there are again two clear incongruences: Iran has a low percentage of smokers but it places second for percentage of deaths (see Table 2). Indonesia is the country with the highest percentage of smokers but it places at the last position in terms of cases of COVID-19 (see Table 2).
Obesity rate and the alcohol consumption
Therefore, I decided to continue the analysis with other factors: the obesity rate and the alcohol consumption (see table 5).
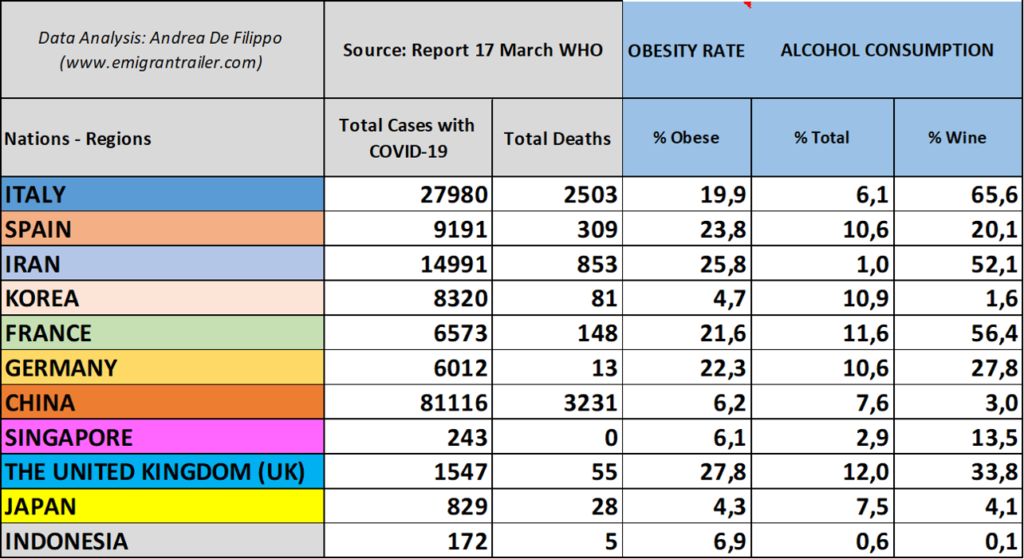
The first surprising information is the value of Iran: second nation with respect to the obesity rate, just behind the United Kingdom (UK). Therefore, this “young country” (see table 3) and “with few smokers” (see table 4) shows one of the highest factors, that could justify its high position in terms of rate of deaths.
The other interesting information is about Japan: an “old country” (see table 3) with a “good number of smokers” (see Table 4) but the one with the lowest value of obesity. The low value of this factor justifies its low position in terms of rate of deaths.
Interestingly, it is worth to remark that all eastern Asian countries (China, Korea, Japan, Singapore and Indonesia) show the lowest values for the obesity rate among all other countries. This would also explain the Singapore case: a country currently with low rates of cases of COVID-19, zero deaths, but with the highest population density and with one of the busiest airport. The latter are two factors that should have enhanced the contagion´s spread.
Coming back to table 5, the alcohol consumption data are also interesting. The source of this data is a WHO report published in 2014 (9789240692763_eng.pdf (who.int)).
Looking directly at the wine consumption, it is worth to note that Italy and Iran have a high rate, significantly higher than the other countries, except than for France. China and Korea do not fit the correlation with the rate of deaths. However, they are also showing very low values for the obesity rate, comparing with the European countries.
In any case, I feel confident to state that both factors (obesity rate and alcohol/wine consumption) play a role in the different rates of deaths among the selected nations. At least, using these factors, it is possible to explain the specific situation for Iran and Japan, addressed in the first part of this article.
The practise of sport
The last aspect I decided to investigate is the following: why Italy and Spain have the fastest contagion´s spread compared to the other European nations? Looking to the former factors (age, smoke, alcohol and obesity rate), the European nations show the worst overall values. There are differences among them, but none is so high to justify a different behavior regarding the spread of the virus and the fatality impact. Now, since I am a runner and I like practicing sport with a strong persuasion that it helps dramatically to stay health on a daily basis, I decided to investigate the data connected to the practice of sport in the different European nations.
In this case, as data source, I used those available in the European Community website (https://ec.europa.eu/eurostat/statistics-explained/index.php/Statistics_on_sport_participation) and those from OECD (Organization for Economic Co-operation and Development), that indicate the amount of expenditure on health pro capite (https://data.oecd.org/healthres/health-spending.htm).
Both set of data are displayed in Table 6.
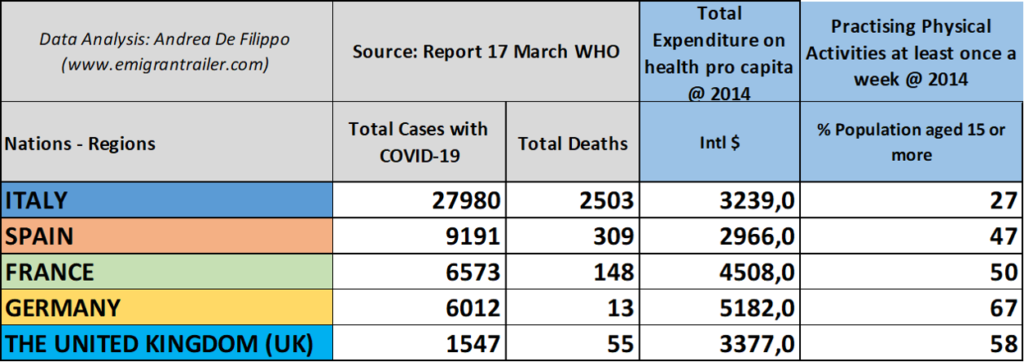
The result is evident and it does not require many interpretations: Italy shows the lowest percentage (27%) of people who practice sports at least once per week. Spain is second-last with 47%, while Germany is at the top with 67%. It might be a case but this classification is inversely proportional to the number of deaths per country (see table 6).
Moreover, Spain and Italy are also the nations with the lowest expenditure on health pro capite (see table 6).
In conclusion, this analysis supports the persuasion that the people and the nations at risk are those with a population:
- With a high rate of over 65;
- With a high obesity rate;
- With a high consumption of alcohol/wine;
- With a low tendency to practice sports
How does this new information fit with the local cases in Italy, namely among the different Italian regions?
The population density, the connectivity/networking of the transport infostructure and the age were already studied and presented in the former article: https://www.emigrantrailer.com/2020/03/16/corona-virus-covid-19-contagions-spread-and-deaths-in-italy/
This proposed update is about the smokers, the overweight and obesity data, and the alcohol consumption from the different regions. The source of data is the national statistics published in 2019 (ISTAT 2019- https://www.istat.it/it/).
In the following tables I added three columns: the total number of the regional population, the percentage versus the total regional population, the percentage calculated versus the total national population. Moreover, I post-processed the official data of the Italian Government, calculating the percentage of deaths versus the total cases of COVID-19 and the total number of medical swabs (the columns with the first rows in blue). I also highlighted in orange the cells where the most relevant or highest values for certain calculated percentages.
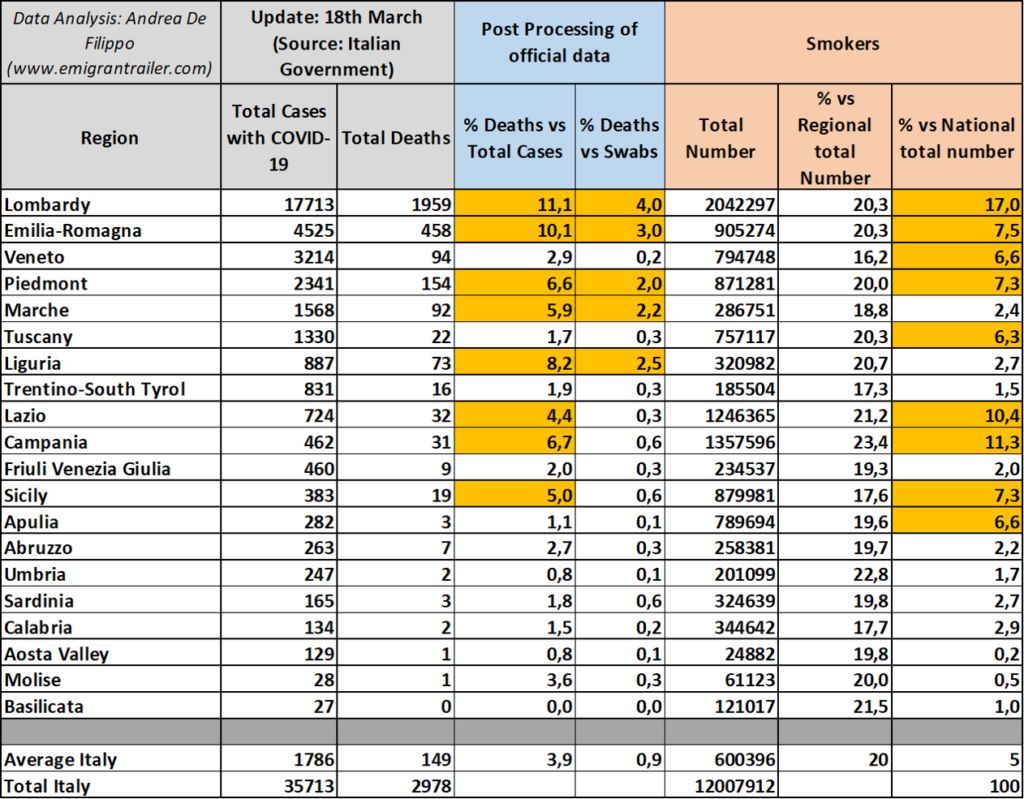
Looking at the statistics for the Italian smokers (Table 7), about 20% of Italian population is used to smoke. The percentage values calculated at regional level indicated that Campania has the highest value (23,4% of its own population) and that Veneto has the lowest value (16,2 % of its own population). Considering the number of smokers of each region versus the overall national number, Lombardy is the major contributor, with 17%, followed by Campania and Lazio.
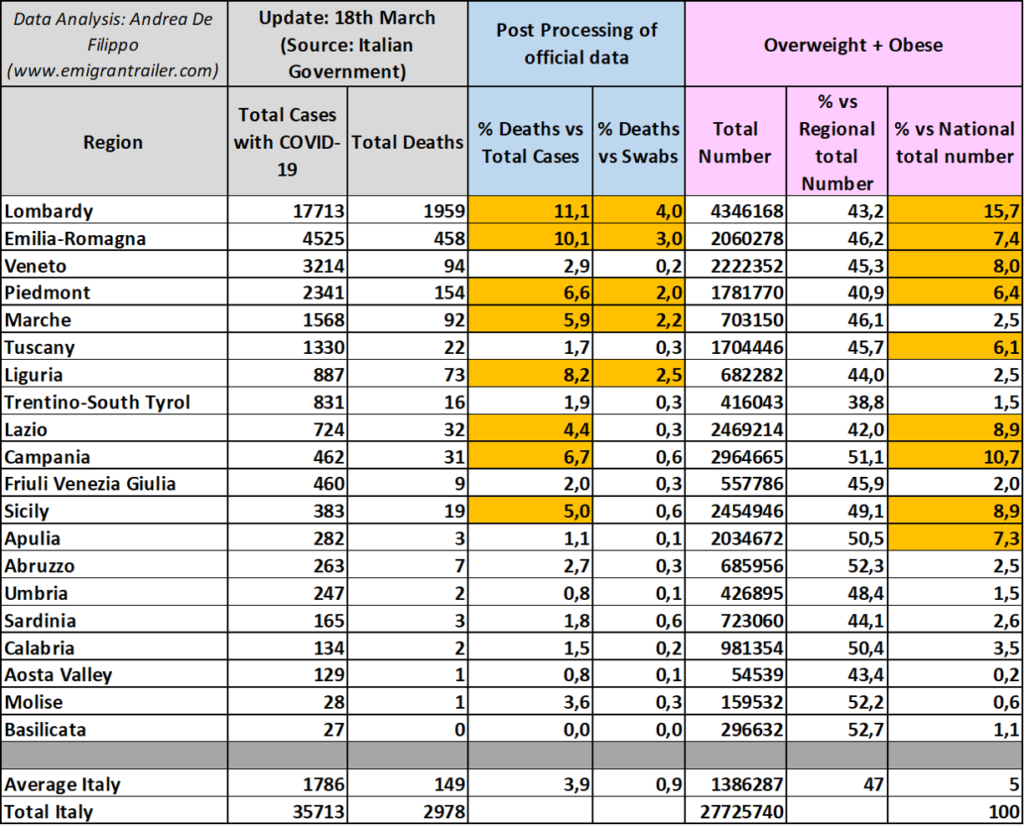
Looking at the statistics for the overweight and obesity in Italy (Table 8) about 47% of Italian population belongs to this category (obesity counts for the 11%). The percentage values calculated at regional level indicated that the southern regions have the highest share. However, considering the total number of each single region versus the overall national number, Lombardy is again the major contributor, with 15,7%, followed by Campania, Lazio and Sicily. It is worth to note that Emilia-Romagna and Veneto are only about 1 -1.5% from Lazio, even if these two regions are less populated (see former article: https://www.emigrantrailer.com/2020/03/16/corona-virus-covid-19-contagions-spread-and-deaths-in-italy/).
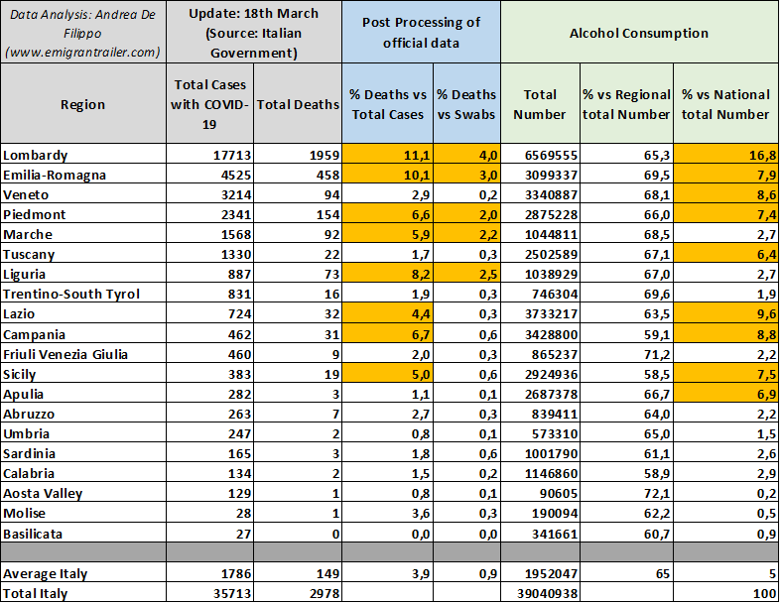
Looking at the statistics for the alcohol consumption in Italy (Table 9), about 65% of Italian population consumed alcohol at least once over the last year. The percentage values calculated at regional level indicates that the northern regions of Aosta Valley and Friuli Venezia Giulia have the highest values (> 70%). Considering the total number of each single region versus the overall national number, Lombardy is the major contributor, with 16,8%, followed by Lazio, Campania, Veneto and Emilia Romagna.
Even if not reported here, analyzing in detail the statistics of ISTAT (https://www.istat.it/it/) , there is again a huge difference in the share among males and females, independently of the age. Namely, 78% of men drinks at least once per year, while the percentage of women barely exceeds 52%. This difference is not trivial. For those who did not follow the recent news from Italy, the fatality for males is about 6% higher than females (http://www.salute.gov.it/portale/news/p3_2_1_1_1.jsp?lingua=italiano&menu=notizie&p=dalministero&id=4232
What are the conclusions?
The most trivial is that Lombardy leads all these categories in terms of total numbers, mainly because it is the most populated region of Italy. This also means that statistically it is expected a higher rate of health problems.
The second information is that there are two regions potentially at risk, as already indicated in my first article: Lazio and Campania. So far, the situation is not dramatic like in the northern regions because the spread of the virus has been slowed down by the isolation protocols. However, it is really crucial that all the people understand that these two regions have potentially all the factors to generate a similar negative scenario like in the Pianura Padana area. Moreover, people might really understand that everybody can be infected and that many are already infected; the contagion is independent by the analyzed factors. In other words, a young and healthy person could also be infected.
The third information is that Veneto is somehow the only region outside the box so far. Namely, all the potential factors are present but the rate of deaths is luckily much lower than the neighboring regions. This requires additional investigation to find a factor that helps to protect against the dramatic consequences of this virus.
Final Information
If you have any questions, comments and suggestions, please do not hesitate to contact me or comment below.
Other information and analysis about Covid-19 at the link: COVID-19 (Corona Virus) | EmigranTrailer.
Stay healthy!
Andrea De Filippo
Original post in english language. For other languages, please open with a web browser (i.e. Chrome) and apply the automatic translation.


